

# 2 Seasonality to your advantage
Higher probability and with less risk

As of this passed Saturday, Bitcoin seasonality is + 173% since I started out the seasonality strategy in early January. Bitcoin itself is "only" + 18% and with higher risk. At one point during the summer, holding the Bitcoins was also a loss. Seasonality performance has held up the entire year.
Advantages of using seasonality as an investing tool:
Makes you able to limit unnecessary market exposure and thereby risk.
An easy way to make decisions in a dedicated fashion.
Backed by research showing it outperforms other strategies.
Makes it easy to structure you plan long time in advance.
It could serve as a supplement or hegde to other market positions.
Mathmatics professor Igor Rivin and Economist Carlo Scevola's are behind the crypto index called CCI30®. This Crypto index is tracking the 30 largest crypto currencies by market capitalization and is excluding stablecoins.
The index' broad coverage, makes it hugely representative of the temprature of the Crypto space. You will get to know about their index methodology here, where Bitcoin weights about 20%. It represents a useful tool for investors and a benchmark for traders and asset managers.
Since the beginning of January, the index is actually 275% higher. My seasonality for the index is + 276%. Both results are fantastic but there is a clue here, - to your advantage.

In the example above the ski-picture, the greatest difference between just holding an investment vs trading seasonality, is that seasonality is more stable in its performance over time. With the development of the index / markets itself, you never know, and its more volatile with markable changes to the value throughout the year. Changes most do not want to feel. There is higher risk to holding onto a position than to go in and out a few dedicated times a year, where you have sequentially historically higher probabilities to succeed.
Let’s say there is a prolonged phase against your traditional position, this could quickly turn devastating to your HODL investments. Seasonality prevails with new attempts according to the pre set seasonality calendar.
With this newsletter, I wish to see more traders and investors actively seeking to use seasonality as a vehice when investing. Seasonality is a protective tool to your own advantage.
Just HODL (only holding on to an investment) can be lucrative - but suddenly - booooom, and there you go - loss, loss loss and for how long you never know.
Over time, research do show seasonality strategies are beating other investment strategies (fundamental or technical).
Dr. William T Ziemba1 is a wise and insightful professor with extensive research in the field. Please look at some of his powerful work here.
How actively are you in using seasonality to your advatage?
Using seasonality as an investment tool eliminates unnecessary market risk and triggers you to stay in (out of) the markets when the probabilities to succeed are higher (lower). In order to get the most out of seasonal variations, you should be present for the long haul, not just for a season or two. The longer you stick to the patterns, the more likely to be successful. The absolute minimum should be a year, and preferably several years.

Here is how to approach the phenomenon of seasonality:
In the chart above you got the seasonal patterns for the Crypto Market represented by the mentioned CCI30® index.
The Light Blue periods are defined as the time periods where history is showing there has been strength. The Pink periods are defineed as the time periods where history is showing there has been weakness. The solid line is switching between Dark Blue and Red as time passes according to the Light Blue and Pink periods.
The solid LIVE line turns from Red to Dark Blue (Dark Blue to Red) when the seasonality calendar changes from its weak (stong) period to a strong (weak) period. The chart shows how the price development is for the index in 2021. As you see, markets are currently in an historically strong phase until last couple of days of December2.
Activly participating in seasonality patterns, means to hold the position whenever there is a Blue (strong) period, and stay away or go short3 whenever there is a Pink (weak) period.
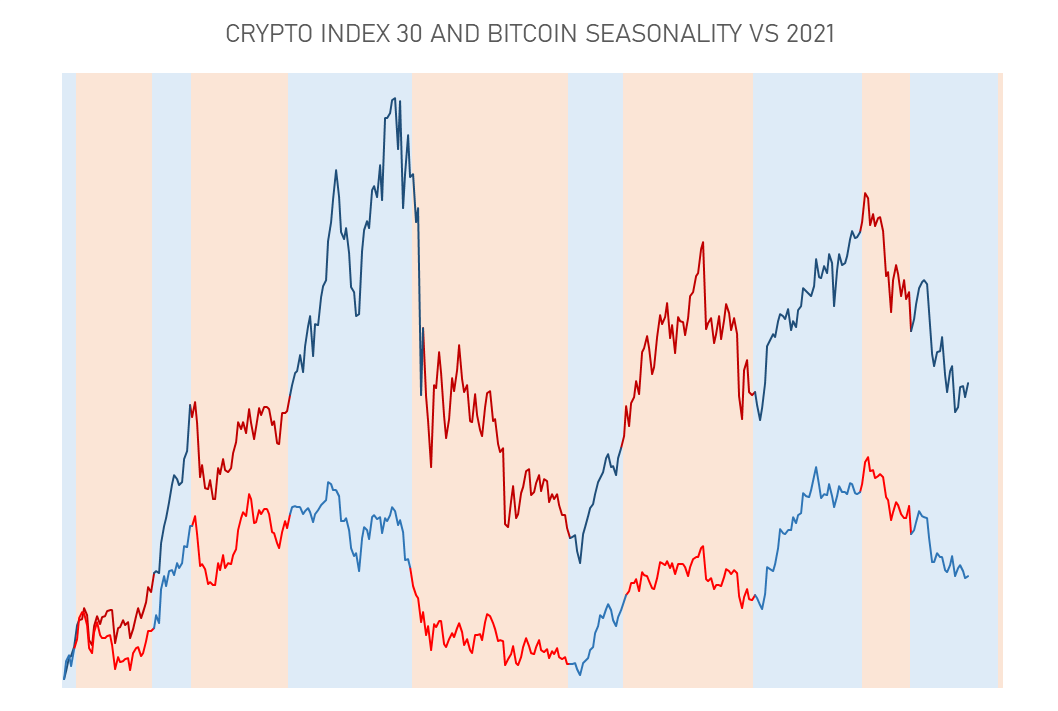
The chart above illustrates the entire Crypto market do move almost 100% in tandem with Bitcoin, even though Bitcoin is ‘just’ 20% of the index.
To find how a financial instrument like the Crypto index could behave during a certain time of the year, we go back in history to find patterns. My extensive research among other professionals, concludes there are dedicated periods of the year that have higher (lower) probabilities of strength (weakness) than others.
An optimal seasonal formula is constructed with 10, 15 and more years of data for valuable results. The Crypto market is somewhat young, but so far I find the data and trading proven enough sufficient to have validity and quality output. My Crypto database is becoming broader and more solid as time passes on, a positive for future research- and trading on seasonality.
In my next issue, I am looking forward to present you the seasonality time line for the entire 2022. Yes, I will ouline the upcoming historically strong and weak periods for the upcoming year and with explainations. It will include Cryptos, Gold and more.
Happy Christmas and happy trading. Look forward to 2022!
Make sure you fully understand how your investments work, and that you can afford to take the high risk of losing your money. Stop losses are always recommended.